
Analyzing Social Media
This tutorial covers how to analyze Twitter data in native JSON format using Apache Drill. First, you configure an environment to stream the Twitter data filtered on keywords and languages using Apache Flume, and then you analyze the data using Drill. Finally, you run interactive reports and analysis using MicroStrategy.
Social Media Analysis Prerequisites
- Twitter developer account
- AWS account
- A MapR node on AWS
- A MicroStrategy AWS instance
Configuring the AWS environment
Configuring the environment on Amazon Web Services (AWS) consists of these tasks:
- Create a Twitter Dev account and register a Twitter application
- Provision a preconfigured AWS MapR node with Flume and Drill
- Provision a MicroStrategy AWS instance
- Configure MicroStrategy to run reports and analyses using Drill
- Create a Twitter Dev account and register an application
This tutorial assumes you are familiar with MicroStrategy. For information about using MicroStrategy, see the MicroStrategy documentation.
Establishing a Twitter Feed and Flume Credentials
The following steps establish a Twitter feed and get Twitter credentials required by Flume to set up Twitter as a data source:
- Go to dev.twitter.com and sign in with your Twitter account details.
- Click Manage Your Apps under Tools in the page footer.
- Click Create New App and fill in the form, then create the application.
- On the Keys and Access Tokens tab, create an access token, and then click Create My Access Token. If you have read-only access, you can create the token.
- Copy the following credentials for the Twitter App that will be used to configure Flume:
- Consumer Key
- Consumer Secret
- Access Token
- Access Token Secret
Provision Preconfigured MapR Node on AWS
You need to provision a preconfigured MapR node on AWS named ami-4dedc47d. The AMI is already configured with Flume, Drill, and specific elements to support data streaming from Twitter and Drill query views. The AMI is publicly available under Community AMIs, has a 6GB root drive, and a 100GB data drive. Being a small node, very large volumes of data will significantly decrease the response time to Twitter data queries.
- In AWS, launch an instance. The AMI image is preconfigured to use a m2.2xlarge instance type with 4 vCPUs and 32GB of memory.
- Select the AMI id ami-4dedc47d.
- Make sure that the instance has been assigned an external IP address; an Elastic IP is preferred, but not essential.
- Verify that a security group is used with open TCP and UDP ports on the node. At this time, all ports are left open on the node.
- After provisioning and booting up the instance, reboot the node in the AWS EC2 management interface to finalize the configuration.
The node is now configured with the required Flume and Drill installation. Next, update the Flume configuration files with the required credentials and keywords.
Update Flume Configuration Files
- Log in as the ec2-user using the AWS credentials.
- Switch to the mapr user on the node using
su – mapr. - Update the Flume configuration files
flume-env.shandflume.conf in the<FLUME HOME>/confdirectory using the Twitter app credentials from the first section. See the sample files. - Enter the desired keywords, separated by a comma. Separate multiple keywords using a space.
- Filter tweets for specific languages, if needed, by entering the ISO 639-1 language codes separated by a comma. If you need no language filtering, leave the parameter blank.
- Go to the FLUME HOME directory and, as user
mapr, type screen on the command line as usermapr: -
Start Flume by typing the following command:
./bin/flume-ng agent --conf ./conf/ -f ./conf/flume.conf -Dflume.root.logger=INFO,console -n TwitterAgent - Enter
CTRL+ato exit, followed bydto detach. To go back to the screen terminal, simply enter screen –r to reattach. Twitter data streams into the system. -
Run the following command to verify volumes:
du –h /mapr/drill_demo/twitter/feed.
You cannot run queries until data appears in the feed directory. Allow 20-30 minutes minimum.
Provision a MicroStrategy AWS Instance
MicroStrategy provides an AWS instance of various sizes. It comes with a free 30-day trial for the MicroStrategy instance. AWS charges still apply for the platform and OS.
To provision the MicroStrategy node in AWS:
- On the MicroStrategy website, click Get started.
- Select some number of users, for example, select 25 users.
- Select the AWS region. Using a MapR node and MicroStrategy instance in the same AWS region is highly recommended.
- Click Continue.
- On the Manual Launch tab, click Launch with EC2 Console next to the appropriate region, and select r3.large instance. An EC2 instance of r3.large is sufficient for the 25 user version.
- Click Configure Instance Details.
- Select an appropriate network setting and zones, ideally within the same zone and network as the MapR node that you provisioned.
- Keep the default storage.
- Assign a tag to identify the instance.
- Select a security group that allows sufficient access to external IPs and open all ports because security is not a concern.
- In the AWS Console, launch an instance, and when the AWS reports that the instance is running, select it, and click Connect.
- Click Get Password to get the OS Administrator password.
Important
Make sure that the MicroStrategy instance has a Public IP; elastic IP is preferred but not essential.
The instance is now accessible with RDP and is using the relevant AWS credentials and security.
Configure MicroStrategy
You need to configure MicroStrategy to integrate with Drill using the ODBC driver. You install a MicroStrategy package with a number of useful, prebuilt reports for working with Twitter data. You can modify the reports or use the reports as a template to create new and more interesting reports and analysis models.
- Configure a System DSN named
Twitterwith the ODBC administrator. The quick start version of the MapR ODBC driver requires the DSN. - Download the quick start version of the MapR ODBC driver for Drill.
- Configure the ODBC driver for Drill on MicroStrategy Analytics. The Drill object is part of the package and doesn’t need to be configured.
- Use the AWS Private IP if both the MapR node and the MicroStrategy instance are located in the same region (recommended).
- Download the Drill and Twitter configuration package for MicroStrategy on the Windows system using Git for Windows or the full GitHub for Windows.
Import Reports
- In MicroStrategy Developer, select Schema > Create New Project to create a new project with MicroStrategy Developer.
- Click Create Project and type a name for the new project.
- Click OK. The Project appears in MicroStrategy Developer.
- Open MicroStrategy Object Manager.
- Connect to the Project Source and login as Administrator.
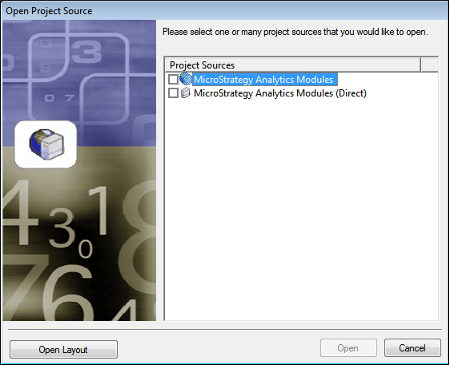
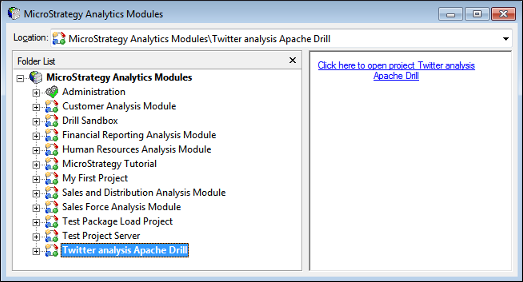
- In MicroStrategy Object Manager, MicroStrategy Analytics Modules, select the project for the package. For example, select Twitter analysis Apache Drill.
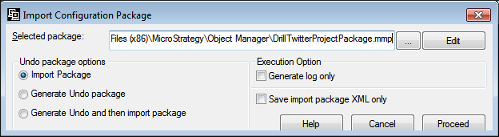
- Select Tools > Import Configuration Package.
- Open the configuration package file, and click Proceed.
 The package with the reports is available in MicroStrategy.
You can test and modify the reports in MicroStrategy Developer. Configure permissions if necessary.
Update the Schema
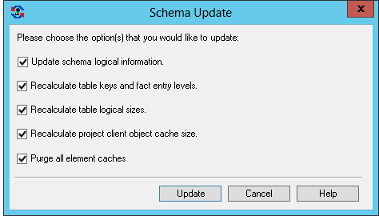
- In MicroStrategy Developer, select Schema > Update Schema.
- In Schema Update, select all check boxes, and click Update.
Create a User and Set the Password
- Expand Administration.
- Expand User Manager, and click Everyone.
- Right-click to create a new user, or click Administrator to edit the password.
About the Reports
There are 18 reports in the package. Most reports prompt you to specify date ranges, output limits, and terms as needed. The package contains reports in three main categories:
- Volumes: A number of reports that show the total volume of Tweets by different date and time designations.
- Top List: Displays the top Tweets, Retweets, hashtags and users are displayed.
- Specific Terms: Tweets and Retweets that can be measured or listed based on terms in the text of the Tweet itself.
You can copy and modify the reports or use the reports as a template for querying Twitter data using Drill.
You can access reports through MicroStrategy Developer or the web interface. MicroStrategy Developer provides a more powerful interface than the web interface to modify reports or add new reports, but requires RDP access to the node.
Using the Web Interface
- Using a web browser, enter the URL for the web interface:
http://
/MicroStrategy/asp/Main.aspx - Log in as the User you created or as Administrator, using the credentials created initially with Developer.
- On the Welcome MicroStrategy Web User page, choose the project that was used to load the analysis package: Drill Twitter Analysis.
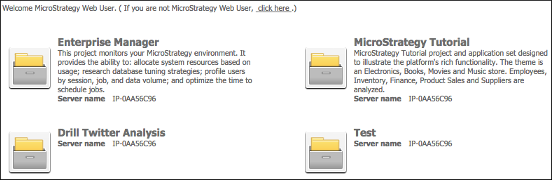
- Select Shared Reports.
The folders with the three main categories of the reports appear.
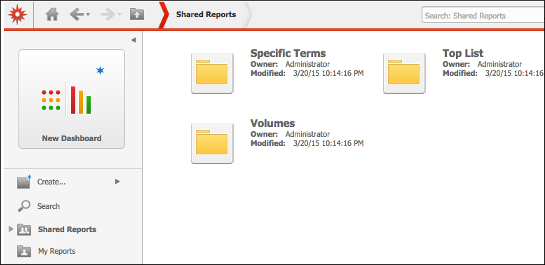
- Select a report, and respond to any prompts. For example, to run the Top Tweet Languages by Date Range, enter the required Date_Start and Date_End.
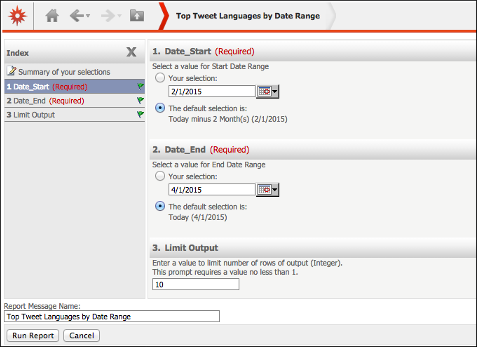
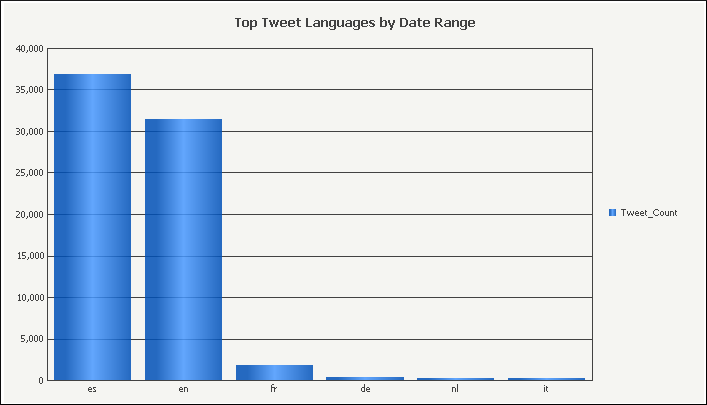
- Click Run Report.
A histogram report appears showing the top tweet languages by date range.
- To refresh the data or re-enter prompt values, select Data > Refresh or Data > Re-prompt.
Browsing the Apache Drill Twitter Analysis Reports
The MicroStrategy Developer reports are located in the Public Objects folder of the project you chose for installing the package.
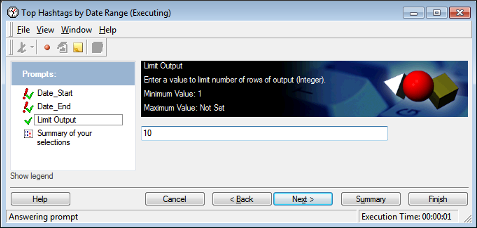
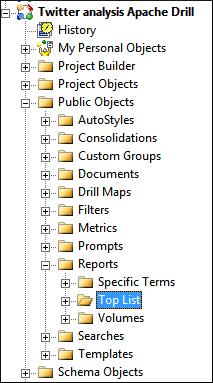 Many of the reports require you to respond to prompts to select the desired data. For example, select the Top Hashtags report in the right-hand column. This report requires you to respond to prompts for a Start Date and End Date to specify the date range for data of interest; by default, data for the last two months, ending with the current date is selected. You can also specify the limit for the number of Top Hashtags to be returned; the default is the top 10 hashtags.
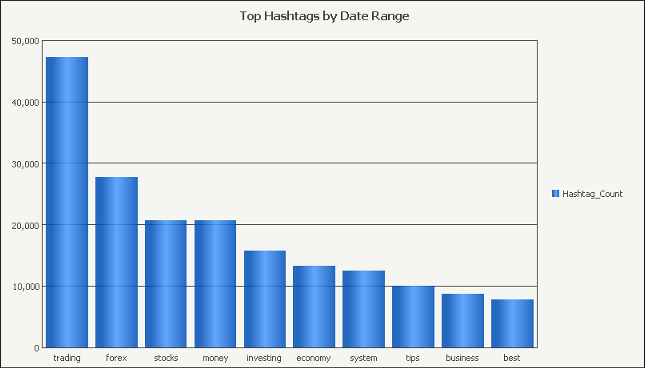
 When you click Finish a bar chart report with the hashtag and number of times it appeared in the specified data range appears.
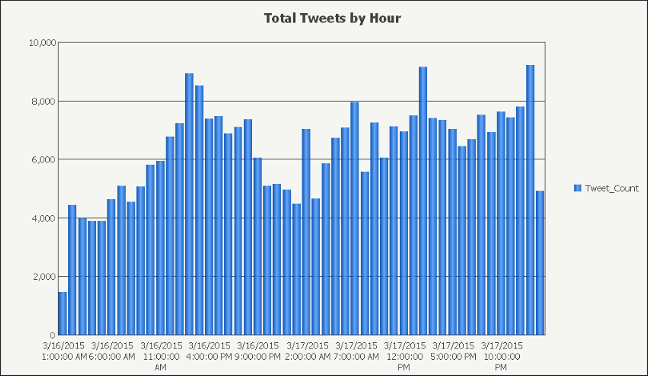
Other reports are available in the bundle. For example, this report shows total tweets by hour:
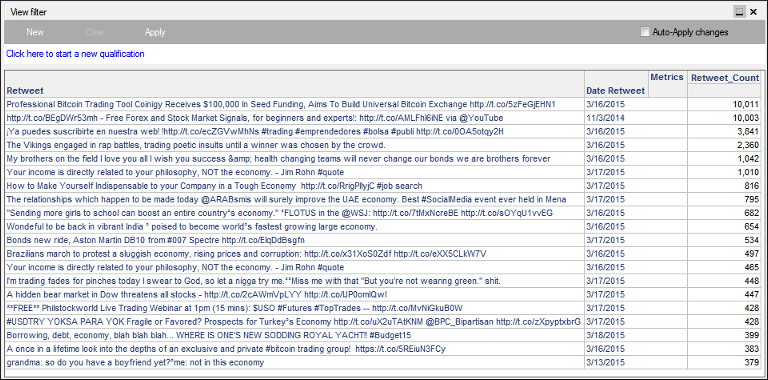
 This report shows top Retweets for a date range with original Tweet date and count in the date range.
Summary
In this tutorial, you learned how to configure an environment to stream Twitter data using Apache Flume. You then learned how to analyze the data in native JSON format with SQL using Apache Drill, and how to run interactive reports and analysis using MicroStrategy.