
Query Plans
If you experience performance issues in Drill, you can typically identify the source of the issues in the query plans or profiles. This section describes the logical plan and physical plans.
Query Plans
Drill has an optimizer and a parallelizer that work together to plan a query. Drill creates logical, physical, and execution plans based on the available statistics for an associated set of files or data sources. The number of running Drill nodes and configured runtime settings contribute to how Drill plans and executes a query.
You can use EXPLAIN commands to view the logical and physical plans for a query, however you cannot view the execution plan. To see how Drill executed a query, you can view the query profile in the Drill Web UI at <drill_node_ip_address>:8047.
Logical Plan
A logical plan is a collection of logical operators that describe the work required to generate query results and define which data sources and operators to apply. The parser in Drill converts SQL operators into a logical operator syntax that Drill understands to create the logical plan. You can view the logical plan to see the planned operators. Modifying and resubmitting the logical plan to Drill (through submit_plan) is not very useful because Drill has not determined parallelization at this stage of planning.
Physical Plan
A physical plan describes the chosen physical execution plan for a query statement. The optimizer applies various types of rules to rearrange operators and functions into an optimal plan and then converts the logical plan into a physical plan that tells Drill how to execute the query.
You can review a physical plan to troubleshoot issues, modify the plan, and then submit the plan back to Drill. For example, if you run into a casting error or you want to change the join ordering of tables to see if the query runs faster. You can modify the physical plan to address the issue and then submit it back to Drill and run the query.
Drill transforms the physical plan into an execution tree of minor fragments that run simultaneously on the cluster to carry out execution tasks. See Query Execution. You can view the activity of the fragments that executed a query in the query profile. See Query Profiles.
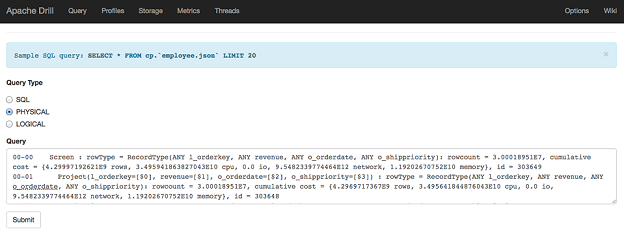
Viewing the Physical Plan
You can run the EXPLAIN command to view the physical plan for a query with or without costing formation. See EXPLAIN for Physical Plans and Costing Information. Analyze the cost-based query plan to identify the types of operators that Drill plans to use for the query and how much memory they will require.
Read the text output from bottom to top to understand the sequence of operators planned to execute the query. You can also view a visual representation of the physical plan in the Profile view of the Drill Web UI. See Query Profiles. You can modify the detailed JSON output, and submit it back to Drill through the Drill Web UI.
The physical plan shows the major fragments and specific operators with correlating MajorFragmentIDs and OperatorIDs. See Operators. Major fragments are an abstract concept that represent a phase of the query execution. Major fragments do not perform any query tasks.
The physical plan displays the IDs in the following format:
<MajorFragmentID> - <OperatorID>
For example, 00-02 where 00 is the MajorFragmentID and 02 is is the OperatorID.
If you view the plan with costing information, you can see where the majority of resources, in terms of I/O, CPU, and memory, will be spent when Drill executes the query. If joining tables, your query plan should include broadcast joins.
Example EXPLAIN PLAN
   0: jdbc:drill:zk=local> explain plan for select type t, count(distinct id) from dfs.`/home/donuts/donuts.json` where type='donut' group by type;
   |------------|------------|
   |   text    |   json    |
   |------------|------------|
   | 00-00 Screen
   00-01   Project(t=[$0], EXPR$1=[$1])
   00-02       Project(t=[$0], EXPR$1=[$1])
   00-03       HashAgg(group=[{0}], EXPR$1=[COUNT($1)])
   00-04           HashAgg(group=[{0, 1}])
   00-05           SelectionVectorRemover
   00-06               Filter(condition=[=($0, 'donut')])
   00-07               Scan(groupscan=[EasyGroupScan [selectionRoot=/home/donuts/donuts.json, numFiles=1, columns=[`type`, `id`], files=[file:/home/donuts/donuts.json]]])...
   …
Modifying and Submitting a Physical Plan to Drill
You can test the performance of a physical plan that Drill generates, modify the plan and then re-submit it to Drill. For example, you can modify the plan to change the join ordering of tables. You can also submit physical plans created outside of Drill through the Drill Web UI.
Note: Only advanced users who know about query planning should modify and re-submit a physical plan.
To modify and re-submit a physical plan to Drill, complete the following steps:
- Run EXPLAIN PLAN FOR
<query>to see the physical plan for your query. - Copy the JSON output of the physical plan, and modify as needed.
- Navigate to the Drill Web UI at
<drill_node_ip_address>:8047. -
Select Query in the menu bar.
- Select the Physical Plan radio button under Query Type.
- Paste the physical plan into the Query field, and click Submit. Drill runs the plan and executes the query.