
Query Profiles
A profile is a summary of metrics collected for each query that Drill executes. Query profiles provide information that you can use to monitor and analyze query performance. When Drill executes a query, Drill writes the profile of each query to disk, which is either the local filesystem or a distributed file system, such as HDFS. As of Drill 1.11, Drill can store profiles in memory instead of writing them to disk. You can view query profiles in the Drill Web UI at http://<IP address or host name>:8047. Starting in Drill 1.16, the Drill Web UI displays warning messages in the query profile if there are issues that have performance impact. In addition to viewing query profiles, you can modify, resubmit, or cancel queries from the Drill Web UI.
The Drill Web UI provides aggregate statistics across profile lists. Profile lists consist of data from major and minor fragments, operators, and input streams. Use query profiles in conjunction with Drill logs to debug issues.
Viewing a Query Profile
You can view query profiles in the Profiles tab of the Drill Web UI. When you select the Profiles tab, you see a list of queries than ran or are currently running in the cluster.
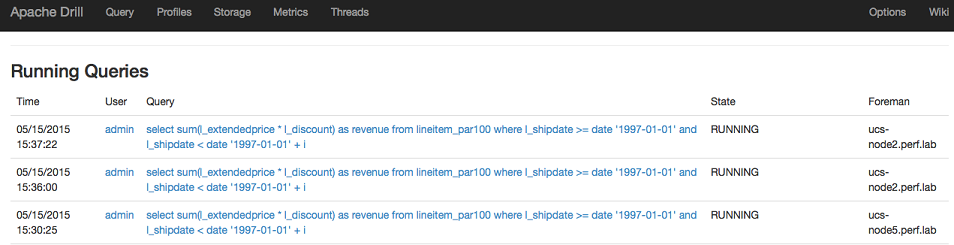
Starting in Drill 1.16, you can sort the columns on the Profiles page. For example, if you want to quickly locate queries with the longest running times, you can sort the Duration column in descending order such that the longest running queries appear at the top of the list. You can also use the Search Profiles field to filter the list of query profiles and then use the sort feature.
For example, the following image shows the query profiles filtered by the mapr user on a specific date with the Duration column sorted in descending order:

To see the profile for a specific query, click on the query in the profiles list.
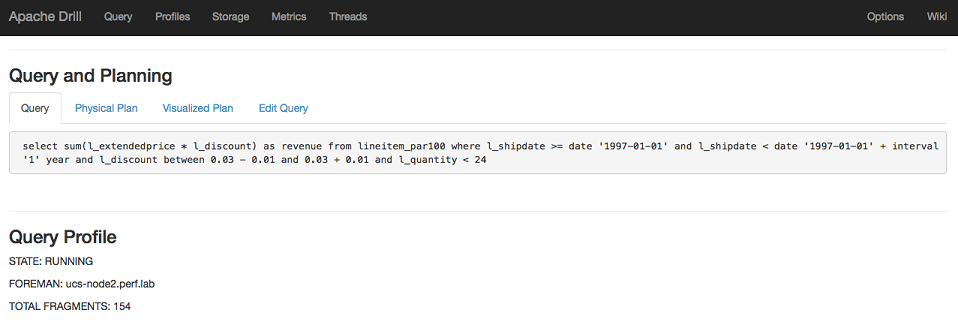
The Query Profile section summarizes a few key details about the query, including:
- The state of the query, either running, completed, or failed.
- The node operating as the Foreman; the Drillbit that receives a query from the client or application becomes the Foreman and drives the entire query.
- The total number of minor fragments required to execute the query.
When you select a profile, notice that the URL in the address bar contains the QueryID, as shown in the following URL:
http://<drill_node>:8047/profiles/2aa98add-15b3-e155-5669-603c03bfde86
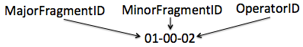
Query, Fragment, and Operator Identifiers
Metrics in a query profile are associated with a coordinate system of identifiers. Drill uses a coordinate system comprised of query, fragment, and operator identifiers to track query execution activities and resources. Drill assigns a unique identifier, the QueryID, to each query received and then assigns an identifier to each fragment and operator that executes the query. An example of a QueryID is 2aa98add-15b3-e155-5669-603c03bfde86. The following image shows an example of fragment and operator identifiers:
Query Profile Warnings
When Drill executes a query, the workload should be uniformly distributed across the fragments and operators processing the data. When you evaluate a query profile in the Drill Web UI, seeing a disproportionate distribution of work across fragments (in terms of time) or excess memory use typically indicates performance issues and requires some performance tuning.
Starting in Drill 1.16, the Drill Web UI displays warning messages in the query profile for the following issues:
- No query progress within a certain amount of time
- Operators spilling data to disk (operators do not have enough memory to complete operations completely in-memory)
- Operators spending significantly more time waiting for data than processing it
In addition to the warnings, the Operator Profiles section of the query profile also displays an icon in the column to indicate which operator is askew.
The following table lists the warnings, icons, configurable options related to the warnings, and option descriptions:
| Warning Message | Icon | Related Option(s) | Description |
|---|---|---|---|
| !WARNING: No fragments have made any progress in the last 300 seconds. (See Last Progress below.) | None | drill.exec.http.profile.warning.progress.threshold | If none of the fragments make any progress within the set time, a warning displays. Time is set in seconds. Default is 300 seconds (5 minutes). You can see fragment activity in the Fragment Profiles section of the query profile. |
| !WARNING: Some operators have data spilled to disk. This will result in performance loss. (See Avg Peak memory and Max Peak Memory below) |  Look for the icon in the Avg Peak Memory and Max Peak Memory columns to find the operators that spilled data to disk. Look for the icon in the Avg Peak Memory and Max Peak Memory columns to find the operators that spilled data to disk. |
See Sort-Based and Hash-Based Memory Constrained Operators for related options. | Hovering the mouse over the icon reveals the average number of spills. The higher the value, the greater the degradation |
| !WARNING: Some of the operators spent more time waiting for data than processing it. (See AVG WAIT TIME as compared to Average Process Time for the operators below) |  Look for the icon in the Max Process Time or Max Wait Time columns to locate the operators that waited or processed too long. Look for the icon in the Max Process Time or Max Wait Time columns to locate the operators that waited or processed too long. |
drill.exec.http.profile.warning.time.skew.min | Sets the minimum threshold for operators with the longest processing or waiting fragment. When the slowest fragment hits this threshold and runs or waits at least 2X (default setting) longer than the average fragment, the Drill Web UI displays a warning message. Default is 2. The drill.exec.http.profile.warning.time.skew.ratio.process option sets the threshold ratio for processing. The drill.exec.http.profile.warning.time.skew.ratio.wait option sets the threshold ratio for waiting. |
| See warning for drill.exec.http.profile.warning.time.skew.min | |
drill.exec.http.profile.warning.time.skew.ratio.process | Defines the threshold ratio for processing. When the maxProcessing:avgProcessing ratio exceeds the defined threshold, the Drill Web UI displays a skew warning. Default is 2. |
| See warning for drill.exec.http.profile.warning.time.skew.min | |
drill.exec.http.profile.warning.time.skew.ratio.wait | Defines the threshold ratio for waiting. When the maxWait:avgWait ratio exceeds the defined threshold, the Drill Web UI displays a skew warning. Default is 2. |
| !WARNING: Some of the SCAN operators spent more time waiting for data than processing it. (See AVG WAIT TIME as compared to Average Process Time for the scan operators below) |  Look for the icon in the Avg Wait Time or Avg Process Time columns to locate the scan operators that waited too long. Look for the icon in the Avg Wait Time or Avg Process Time columns to locate the scan operators that waited too long. |
drill.exec.http.profile.warning.scan.wait.min | Sets a minimum threshold ratio for the scan operator to wait. When the average wait time exceeds the processing time the Drill Web UI displays the warning. Default is 60 seconds. |
Configuring Warning Threshold Options
You can configure thresholds for the warnings through configuration options in the drill-override.conf file, as shown:
http: {
    profile.warning: {
        progress.threshold: 300,
        time.skew: {
            min: 2,
            ratio: {
                process: 2
                wait: 2
            }
        },
        scan.wait.min: 60
    },
    ...
}
You must restart Drillbits after you modify drill-override.conf.
The following sections describe the Fragment Profiles and Operator Profiles sections of the Drill Web UI in more detail.
Fragment Profiles
Fragment profiles provides an overview table and a major fragment block for each major fragment. Each row in the Overview table provides the number of minor fragments that Drill parallelized from each major fragment, as well as aggregate time and memory metrics for the minor fragments.
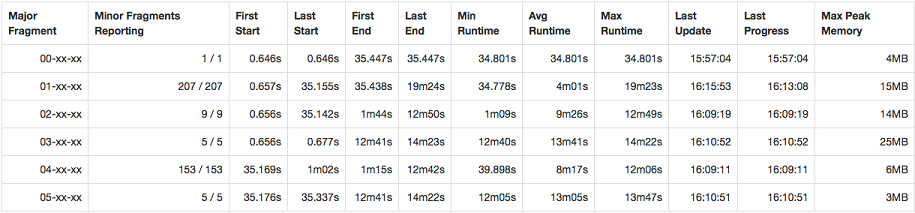
When you look at the fragment profiles, you may notice that some major fragments were parallelized into substantially fewer minor fragments, but happen to have the highest runtime. Or, you may notice certain minor fragments have a higher peak memory than others. When you notice these variations in execution, you can delve deeper into the profile by looking at the major fragment blocks.
Major fragment blocks correspond to a row in the Overview table. You can expand the blocks to see metrics for all of the minor fragments that were parallelized from each major fragment, including the host on which each minor fragment ran. Each row in the major fragment table presents the fragment state, time metrics, memory metrics, and aggregate input metrics of each minor fragment.

When looking at the minor fragment metrics, verify the state of the fragment. A fragment can have a “failed” state which may indicate an issue on the host. If the query itself fails, an operator may have run out of memory. If fragments running on a particular node are under performing, there may be multi-tenancy issues that you can address.
A graph illustrates the activity of major and minor fragments for the duration of the query. The graph correlates with the visualized plan graph in the Visualized Plan tab. Each color in the graph corresponds to the activity of one major fragment.
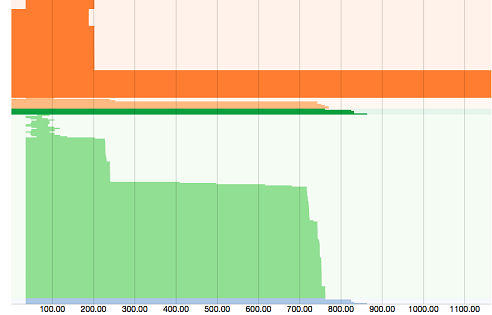
Stair steps in the graph indicate that the execution work of the fragments is not distributed evenly. This typically occurs for non-local reads on data. To address this issue, you can increase data replication, rewrite the data, or file a JIRA to get help with the issue.
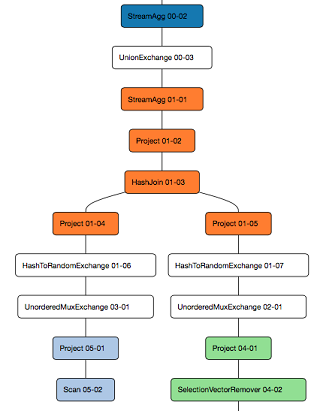
The visualized plan illustrates color-coded major fragments divided and labeled with the names of the operators used to complete each phase of the query. Exchange operators separate each major fragment. These operators represent a point where Drill can execute operations below them in parallel.
Operator Profiles
Operator profiles describe each operator that performed relational operations during query execution. The Operator Profiles section provides an Overview table of the aggregate time and memory metrics for each operator within a major fragment.
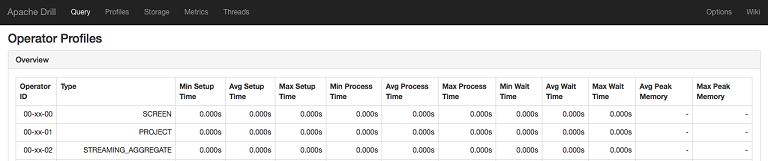
Identify the operations that consume a majority of time and memory. You can potentially modify options related to the specific operators to improve performance.
Below the Overview table are operator blocks, which you can expand to see metrics for each operator. Each of these blocks corresponds to a row in the Overview table. Each row in the Operator block presents time and memory metrics, as well as aggregate input metrics for each minor fragment.
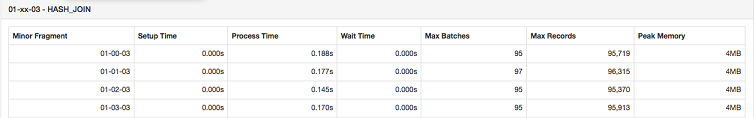
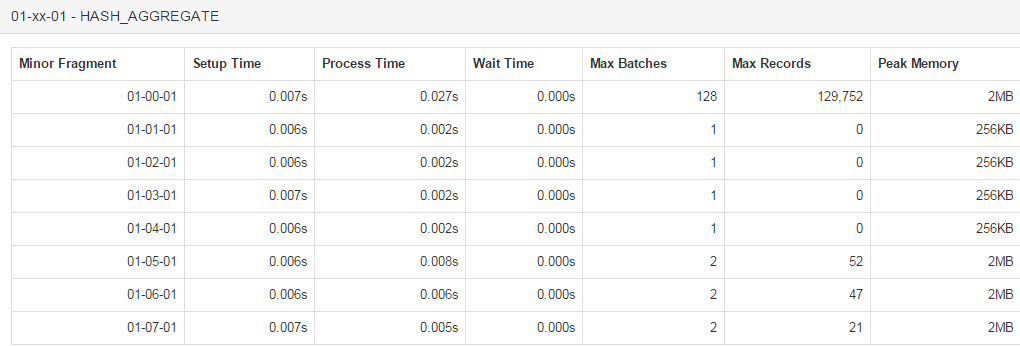
Drill uses batches of records as a basic unit of work. The batches are pipe-lined between each operation. Record batches are no larger than 64K records. While the target size of one record batch is generally 256K, they can scale to many megabytes depending on the query plan and the width of the records.
The Max Records number for each minor fragment should be almost equivalent. If one, or a very small number of minor fragments, perform the majority of the work, there may be data skew. To address data skew, you may need change settings related to table joins or partition data to balance the work.
Data Skew Example The following query was run against TPC-DS data:
   0: jdbc:drill:zk=local> select ss_customer_sk, count(*) as cnt from store_sales where ss_customer_sk is null or ss_customer_sk in (1, 2, 3, 4, 5) group by ss_customer_sk;
   |-----------------|---------|
   | ss_customer_sk  |   cnt   |
   |-----------------|---------|
   | null            | 129752  |
   | 5               | 47      |
   | 1               | 9       |
   | 2               | 43      |
   | 4               | 10      |
   | 3               | 11      |
   |-----------------|---------|
   6 rows selected
In the result set, notice that the ‘null’ group has 129752 values while others have roughly similar values.
Looking at the operator profile for the hash aggregate in major fragment 00, you can see that out of 8 minor fragments, only minor fragment 1 is processing a substantially larger number of records when compared to the other minor fragments.
In this example, there is inherent skew present in the data. Other types of skew may not strictly be data dependent, but can be introduced by a sub-optimal hash function or other issues in the product. In either case, examining the query profile helps understand why a query is slow. In the first scenario, it may be possible to run separate queries for the skewed and non-skewed values. In the second scenario, it is better to seek technical support.
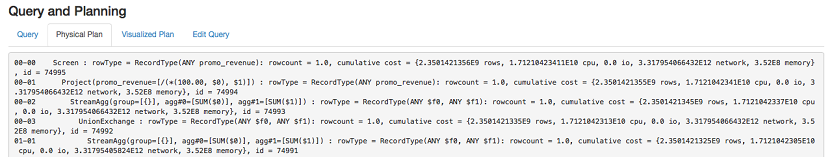
Physical Plan View
The Physical Plan view provides statistics about the actual cost of the query operations in terms of memory, I/O, and CPU processing. You can use this profile to identify which operations consumed the majority of the resources during a query, modify the physical plan to address the cost-intensive operations, and submit the updated plan back to Drill. See Costing Information.
Canceling a Query
You may want to cancel a query if it hangs or causes performance bottlenecks. You can cancel a query from the Profile tab of the Drill Web UI.
To cancel a query, complete the following steps:
- Navigate to the Drill Web UI at
<drill_node_ip_address>:8047. The Drill node from which you access the Drill Web UI must have an active Drillbit running. - Select Profiles in the toolbar. A list of running and completed queries appears.
- Click the query for which you want to see the profile.
- Select Edit Query.
- Click Cancel query to cancel the query.
The following message appears:
Cancelled query <QueryID\>